QLC NVMe SSDs Are Optimal for Modern Workloads
What are QLC SSDs?
At four bits per cell, quad-level cell (QLC) technology expands data capacity beyond single-level cell (SLC), multi-level cell (MLC), and triple-level cell (TLC) solid state drives (SSDs). The greater density provided by QLC drives enables more capacity in the same space, for a lower cost per gigabyte.

Why are QLC NAND SSDs needed now?
More data is being created, stored, and analyzed than ever before. High-growth segments in computing today—such as artificial intelligence (AI) and machine learning (ML), big data/analytics, hyperconverged infrastructure (HCI), high-performance computing (HPC), content-delivery networks (CDNs), cloud digital video recorder (cDVR), and cloud storage—all require access to ever-expanding data volumes. And because these workloads need rapid, high bandwidth access to data, they require read-optimized performance with low latency.
While hard disk drives (HDDs) have historically been the standard for warm storage, they are struggling to keep up with the demands for these read-intensive workloads. Additionally, HDDs require a significant footprint in the data center, which adds to space, power, and cooling costs.
TLC NAND SSDs, on the other hand, are a good fit for mixed and write-heavy workloads, but they are typically not as cost-effective and capacity-optimized for large-scale, read-centric data needs. With 33% more bits per cell than TLC NAND SSDs, and efficient form factors providing up to 61.44TB of storage, Solidigm QLC NAND SSDs enable both accelerated data access and high capacities (see Table 1).

Table 1. QLC SSDs: The sweet spot for read-intensive workloads
Solidigm QLC 3D SSDs: Unlocking the value of stored data
Like TLC NAND SSDs, QLC NAND SSDs can saturate the PCIe 4.0 bus on the read side and have near-TLC-like latency and quality of service (QoS). This makes the drive orders of magnitude more responsive than HDDs (see Table 2).

Table 2. How QLC SSDs compare to HDDs and TLC SSDs
Modern workloads: Characteristics and storage needs
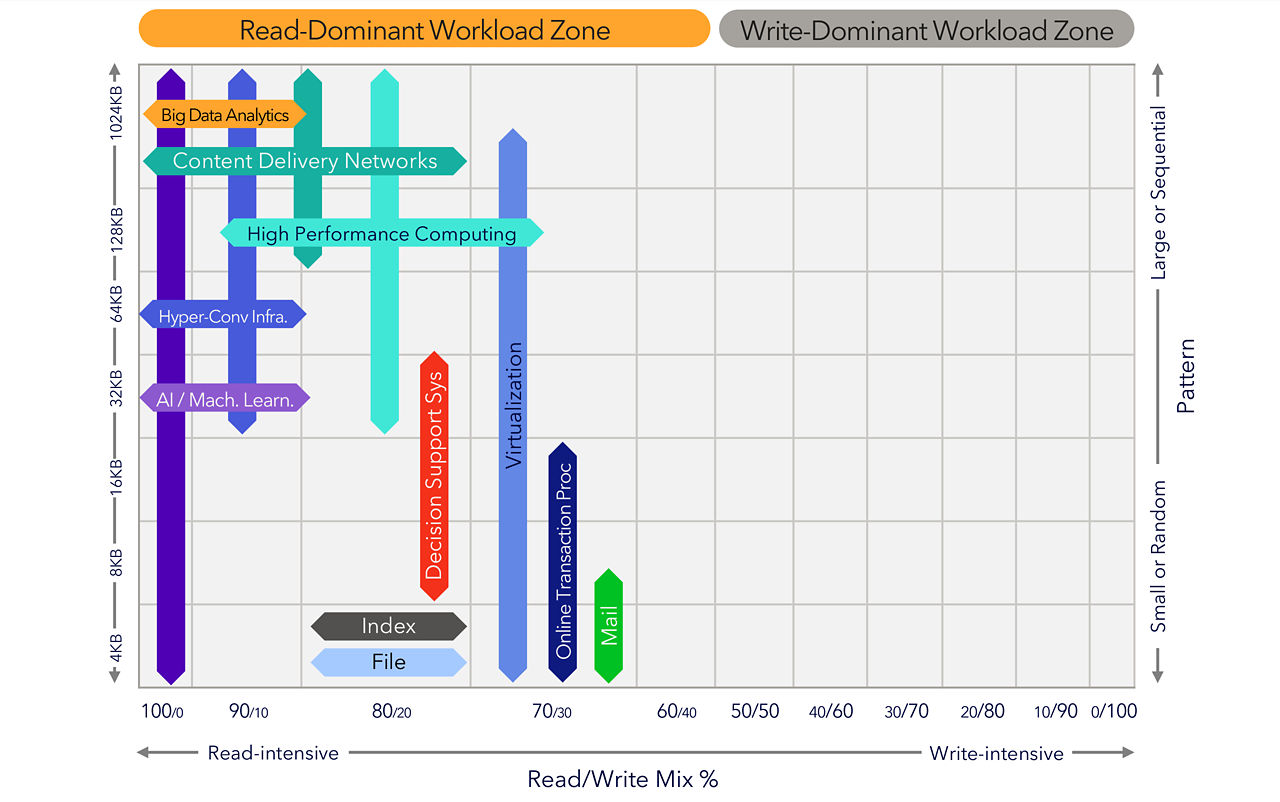
QLC SSDs are optimized for read-intensive workloads needing rapid access to vast datasets. Figure 1 shows examples of a range of workloads [7] that QLC NAND is well suited for based on I/O patterns.

Figure 1. QLC SSDs are optimized for read-intensive workloads
Modern workload characteristics
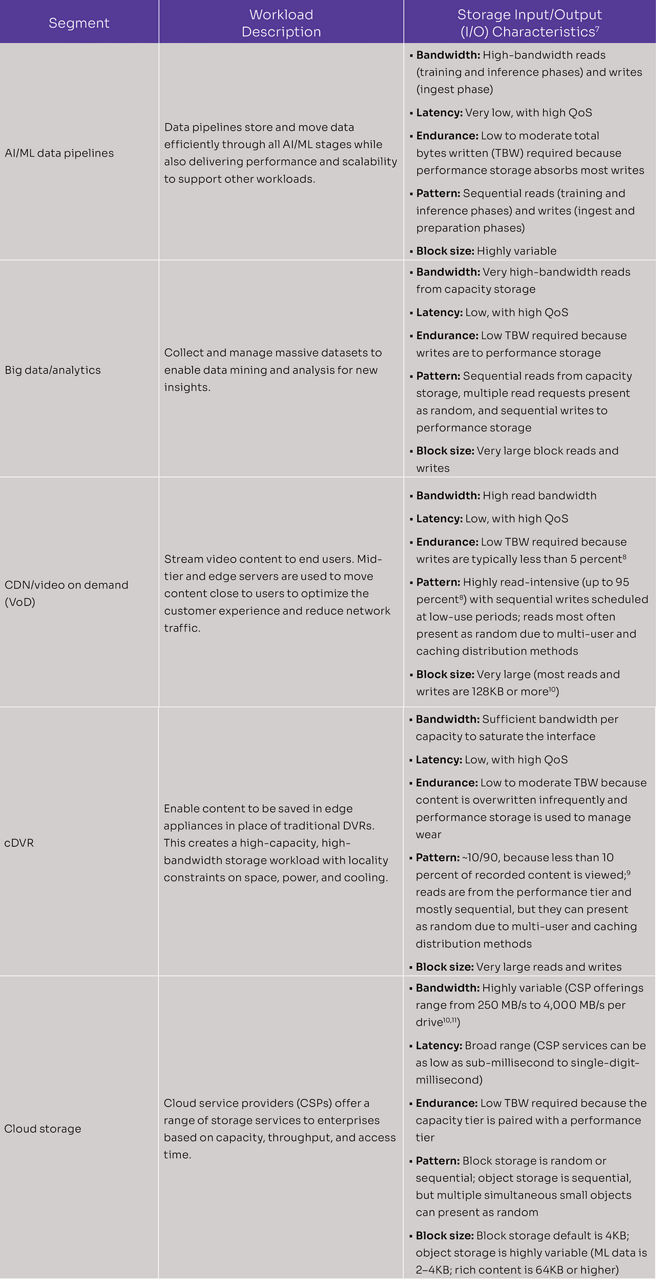
The unique characteristics of these workloads are detailed in Table 3, with call outs for the bandwidth, latency, endurance, pattern, and block size for each segment and a description of the workload.

Table 3. Best-fit QLC SSD segments and workloads
Extract more value from your data with Solidigm QLC 3D SSDs
Built on proven technology, Solidigm QLC 3D SSDs provide exceptional high-bandwidth, low-latency read performance to support modern business-critical workloads, including ML, AI, CDNs, analytics, and big data while helping to lower TCO compared to HDDs and TLC SSDs by consolidating the storage footprint and reducing operational costs. Visit our D5 Series page to learn more.
Notes
[1] “Up to 18x reduction of warm storage footprint” claim is based on comparing 20TB HDDs, which require 18 (2U) of rack space to fill up 2PB or storage, against 61.44TB Solidigm SSD D5-5336 E1.L drives, which require 1U of rack space to fill up 2PB of storage.
[2] Comparing object storage solutions with a 100PB total solution capacity. All-QLC single-layer capacity configuration: Solidigm D5 P5336, 61.44TB, U.2, 7000 MB/s throughput, 16W average active write power, 5W idle power, 95% capacity utilization, RAID 1 mirroring, calculated duty cycle 8.9%. Hybrid configuration: Capacity layer- Seagate EXOS X20 20TB SAS HDD ST18000NM007D (https://www.seagate.com/products/enterprise-drives/exos-x/x20/), 70% short-stroked throughput calculated to 500 MB/s; 9.4W average active power, 5.4W idle power, Hadoop Triplication, 20% duty cycle: Cache layer – Micron 7450 15.36TB, 6800 MB/s throughput, 16.6W average active write power, 5W idle power, 7% cache to capacity ratio recommended to meet customer SLAs; https://www.micron.com/products/ssd/product-lines/7450.
[3] Sequential read performance based on Solidigm SSD D5-P5316 (https://www.seagate.com/www-content/product-content/enterprise-hdd-fam/exos-x18/_shared/en-us/docs/100865854a.pdf)
[4] Seagate. Exos X20 SATA Product Manual.” https://www.seagate.com/products/enterprise-drives/exos-x/x20/.
[5] “Solidigm D5-5336 Series: https://www.solidigm.com/products/data-center/d5/p5336.html
[6]Solidigm SSD D7-P5520 Series: https://www.solidigm.com/products/data-center/d7/p5520.html (Distributed Asynchronous Object Storage)
[7]Storage workload characterizations are, unless noted otherwise, Solidigm estimates based on subject-matter expert deep knowledge of storage I/O patterns and behavior for a given segment.
[8] Percentage is an estimate based on Solidigm internal analysis across top tier CDNs.
[9] Percentage is an estimate based on Solidigm internal analysis across top tier cDVRs.
[10] Amazon AWS. “Amazon EBS Volume Types.” https://docs.amazonaws.cn/en_us/AWSEC2/latest/UserGuide/ebs-volume-types.html.
[11] Tencent. “An Overview of Cloud Hard Drive Prices.” https://cloud.tencent.com/document/product/362/2413.
Performance varies by use, configuration and other factors. Learn more at https://www.solidigm.com/products/data-center/d5.html
Performance results are based on testing as of dates shown in configurations and may not reflect all publicly available updates. See backup for configuration details. No product or component can be absolutely secure.
Your costs and results may vary.
Solidigm technologies may require enabled hardware, software, or service activation.
Solidigm does not control or audit third-party data. You should consult other sources to evaluate accuracy.
© Solidigm 2023.