Understanding Workload and Solution Requirements For PCIe Gen 4 SSDs
Co-authors: Tahmid Rahman, Ratnesh Muchhal, Bill Panos, Yuyang Sun, Paul Genua, and Barsha Jain
Data center operators have been attempting to balance data growth, increased user expectations, and budgetary challenges for quite some time. With data growth continuing at a virtually unlimited rate, the rate of SSD spending in data centers now outpaces global gross domestic product (GDP) by a factor of 8x and outpaces spending on compute by a factor of 4x. [1] But choosing the right SSD that can meet storage needs today and tomorrow—while ensuring that investments are sound—can be daunting.
What are QLC NAND SSDs?
At four bits per cell, quad-level cell (QLC) NAND technology expands data capacity beyond single-level cell (SLC), multi-level cell (MLC), and triple-level cell (TLC) NAND solid state drives (SSDs). The greater density provided by QLC drives enables more capacity in the same space, for a lower cost per gigabyte. Accelerate access to vast datasets with read-performance-optimized, high density PCIe QLC NAND SSDs from Solidigm.
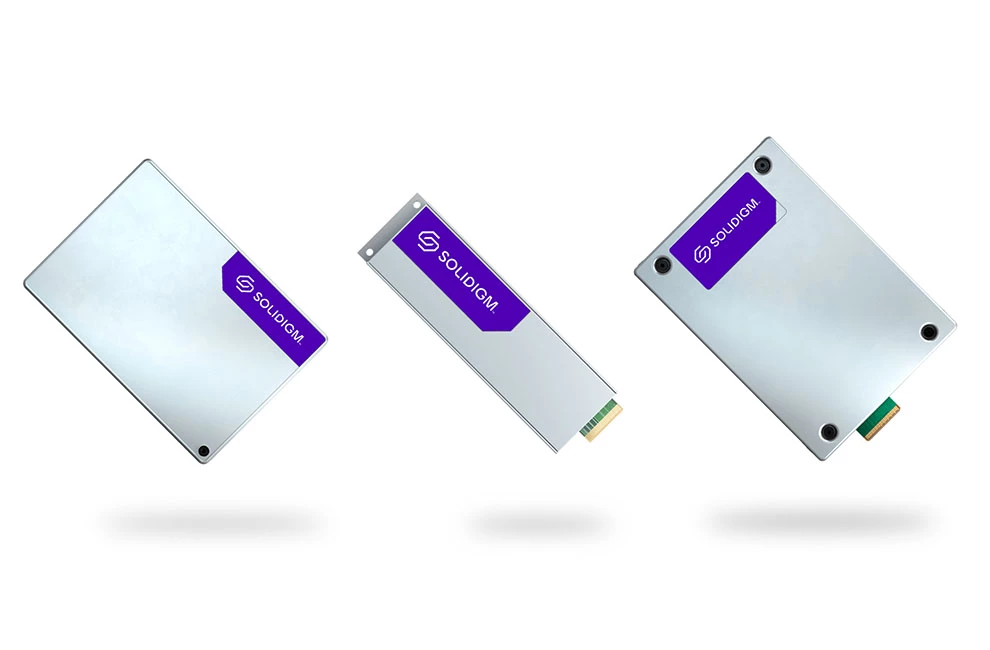
Based on Solidigm’s research and a consensus of industry examination, this paper sheds light on the areas that impact SSD choice to help make the decision less onerous. First, it outlines key storage trends and the challenges they present. Next, it covers how to use storage workload profiles to match application requirements to a drive’s capabilities. The paper also provides the following recommended top-four criteria for evaluating the best-fit SSD to address data center storage challenges:
- Map drive capabilities to application requirements. Any storage decision should start with an understanding of the input/output (I/O) profile of the target workload(s) to pair with SSDs that can provide the right blend of performance, capacity, and endurance.
- Validate endurance requirements. Do not over-size drive endurance. Increased understanding of endurance requirements is correlated with year-over-year reductions in average endurance levels of SSD shipments. Additionally, decision makers should look beyond drive writes per day (DWPD) to assess endurance requirements by considering petabytes written (PBW), which factors in both a drive’s DWPD rating and its capacity to provide the lifetime writes available. An endurance estimator or profiler can be used for enhanced clarity on matching a workload to a drive’s PBW.
- Consider a modern form factor. While legacy form factors preserve chassis infrastructure, Enterprise and Datacenter Standard Form Factor (EDSFF) drives provide better serviceability, space efficiency, flexibility, cooling, and signal integrity benefits.
- Be absolutely confident in drive and data reliability. The most basic storage requirements are: 1) to be always available, and 2) to never return bad data. It’s important to consider the track record of any SSD suppliers’ drive reliability and data integrity.
The rapid evolution of storage
Storage is evolving rapidly because enterprises need to store more data, in more places, more efficiently. This change is happening due to four underlying trends.
The rise of more read/data-intensive workloads
Modern workloads are data hungry. Workloads such as data pipelines for data-intensive usages like artificial intelligence (AI), machine learning (ML) and data analytics, content delivery networks (CDNs), video-on-demand (VoD) services, and imaging databases deliver more value and provide more insights as datasets become bigger. These workloads are being adopted broadly across industries. Read-dominant (approximately 80% or higher reads) storage workloads now account for approximately 94% of enterprise workloads. [2]

Workloads that are mostly read/data-intensive require SSDs that can deliver a balance of dense, affordable-capacity, segment-optimized performance and endurance, which differs from the more balanced read/write performance at lower capacities required in more write-intensive workloads.
Reshaping of servers from core data center to the edge
By 2023, worldwide spending on edge computing is expected to reach $208 billion, an increase of 13.1% over 2022. [4] As data storage moves closer to the point of consumption, servers will face more challenging considerations for space, power, cooling, weight, serviceability, and scalability. Almost everything comes down to these considerations, as noted by a Linux Foundation report, stating that “the higher the density, the more we can do at the edge.” [5] SSDs architected for optimal density and efficiency will be best suited to meeting challenges at the edge.
Emerging understanding of real-world I/O conditions
When SSDs were first deployed in data centers in the 2010s, the behavior of drives and the needs of workloads were not well understood. As a result, storage architects tended to oversize SSDs. Reports show that in 2016 about 60% of SSDs that were shipped had endurance levels of ≤1 DWPD, compared to 2023, during which that figure is expected to approach 85%. [6]Large-sample-size studies show that 99% of systems use at most 15% of a drive’s usable endurance by the end of life. [7] Over-sizing can lead to higher acquisition costs, implementation costs, and operating costs.
But it’s not just endurance that is better understood today. Storage engineers and managers are beginning to look beyond the traditional “four corners” of storage testing: 100% random reads, random writes, sequential reads, and sequential writes at a queue depth (QD) of about 256 for sequential and 128 for random. Instead, engineers and managers are considering the I/O characteristics of real-world applications such as those shown in Table 1.
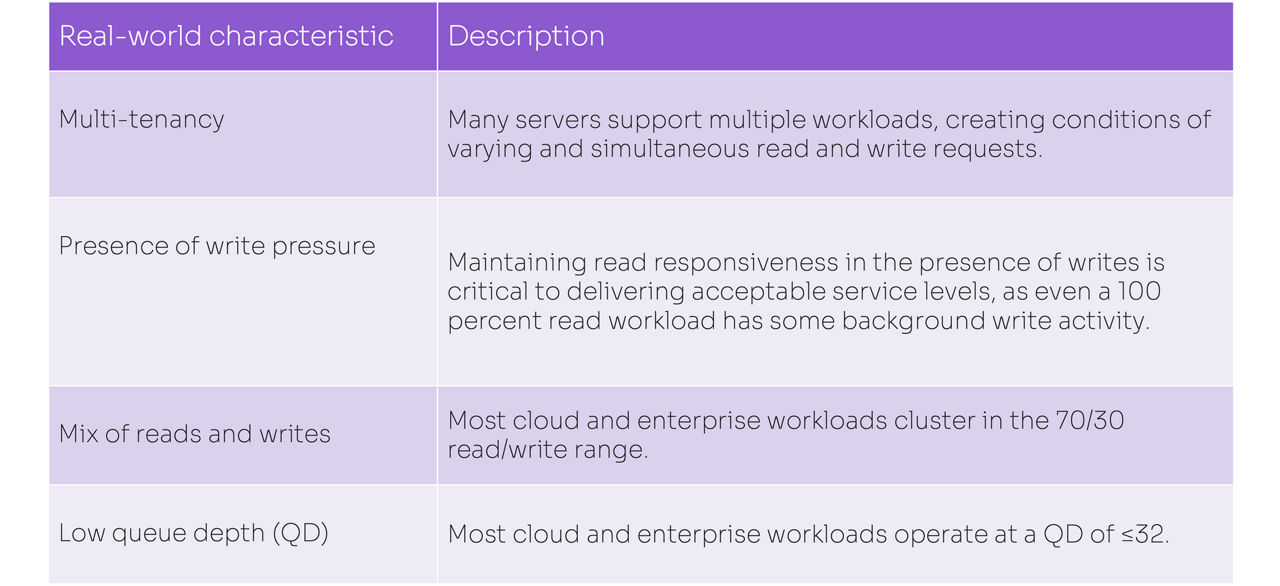
Table 1. I/O characteristics of real-world applications
Hard disk drive (HDD) storage is unsustainable
Solidigm’s internal analysis and a consensus of industry analysts estimate that 85% to 90% of all data center data is still stored on HDDs. This aging infrastructure places a burden on its ability to manage costs, scale with demands, and improve sustainability in the data center. [8]that aging gear is the top storage challenge for storage managers. Furthermore, the study shows that aging gear directly leads to other challenges, such as a lack of capacity, high operations and maintenance costs, and poor performance. Modern data centers need storage that can deliver the right balance of capacity, performance, efficiency, and reliability to match workload requirements.
Understanding storage I/O profiles
Modern storage workloads span a wide range of I/O profiles. To describe these workloads, the storage industry uses a common set of I/O characteristics (Table 2). There are more I/O characteristics than those captured in the table (such as the rate at which certain applications write data), but this list is sufficient to gain a basic understanding of requirements for different workloads.
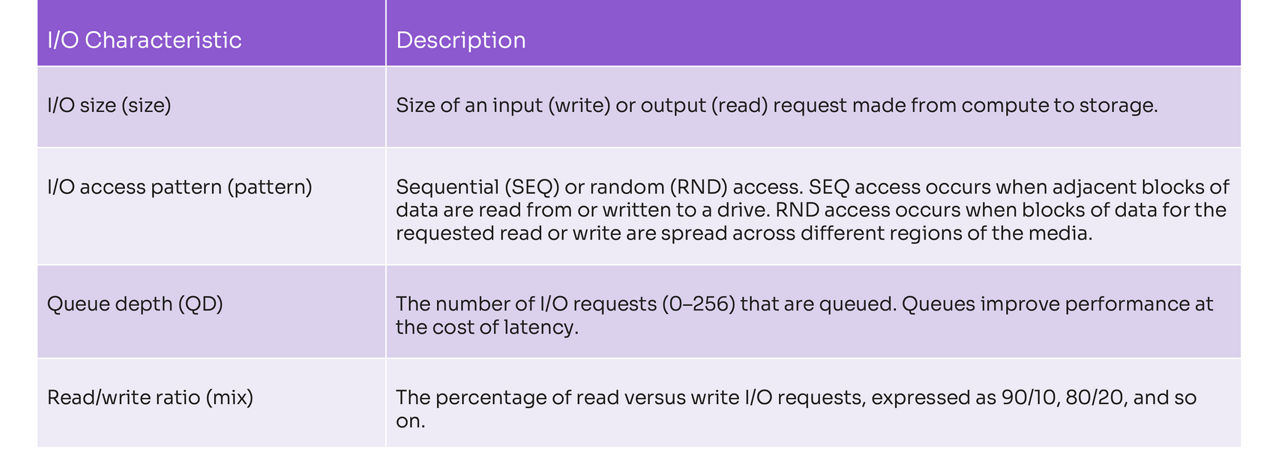
Table 2. Common I/O characteristics
Using these I/O profile characteristics, Solidigm places application workloads into four main categories:
- Write-centric workloads
- Mixed workloads
- Mainstream workloads
- Read/data-intensive workloads
While I/O profiles can vary based on specifics of implementation, these profiles are a best effort at describing a typical profile and are helpful in the drive-selection process.
1. Write-centric workloads
These applications (see Table 3) drive a high intensity of writes, comprising 50% to 100% of I/O. Write-centricity can also be dictated by usages such as when a drive is deployed for caching or as a temporary buffer. These applications and usages are best serviced by drives with strong write performance and high endurance.
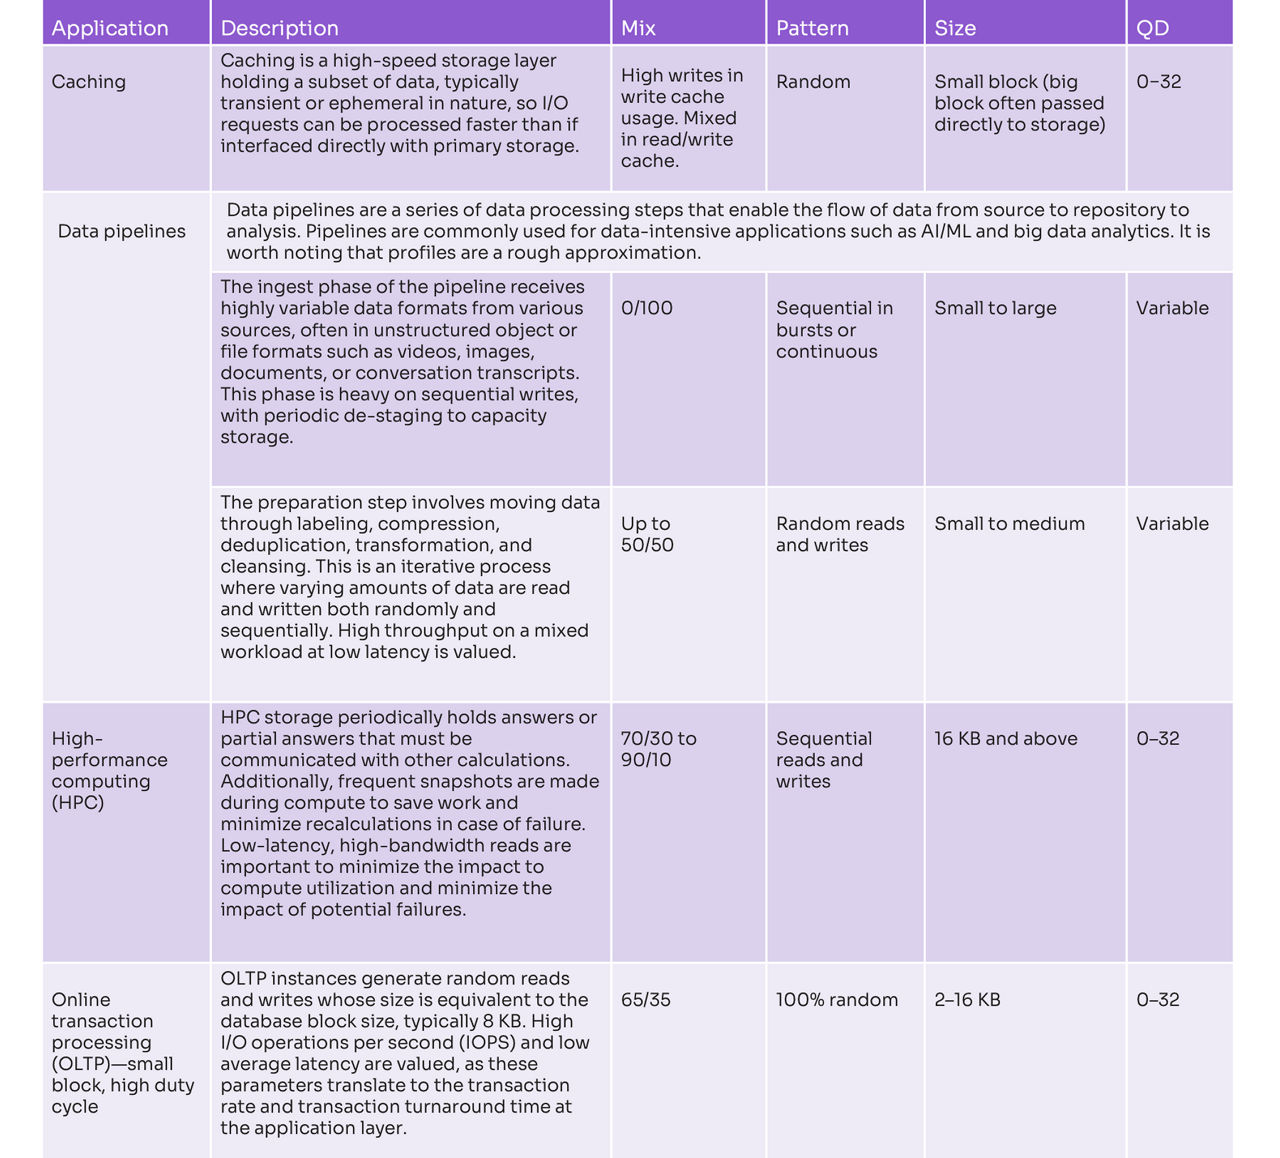
Table 3. Examples of applications with write-centric workloads
2. Mixed workloads
Mixed workloads tend to cluster in the 70/30 read/write ratio range and generally present a high degree of randomness. Given the mix of reads and writes, these applications are best suited by drives with high, balanced read/write performance and high endurance.
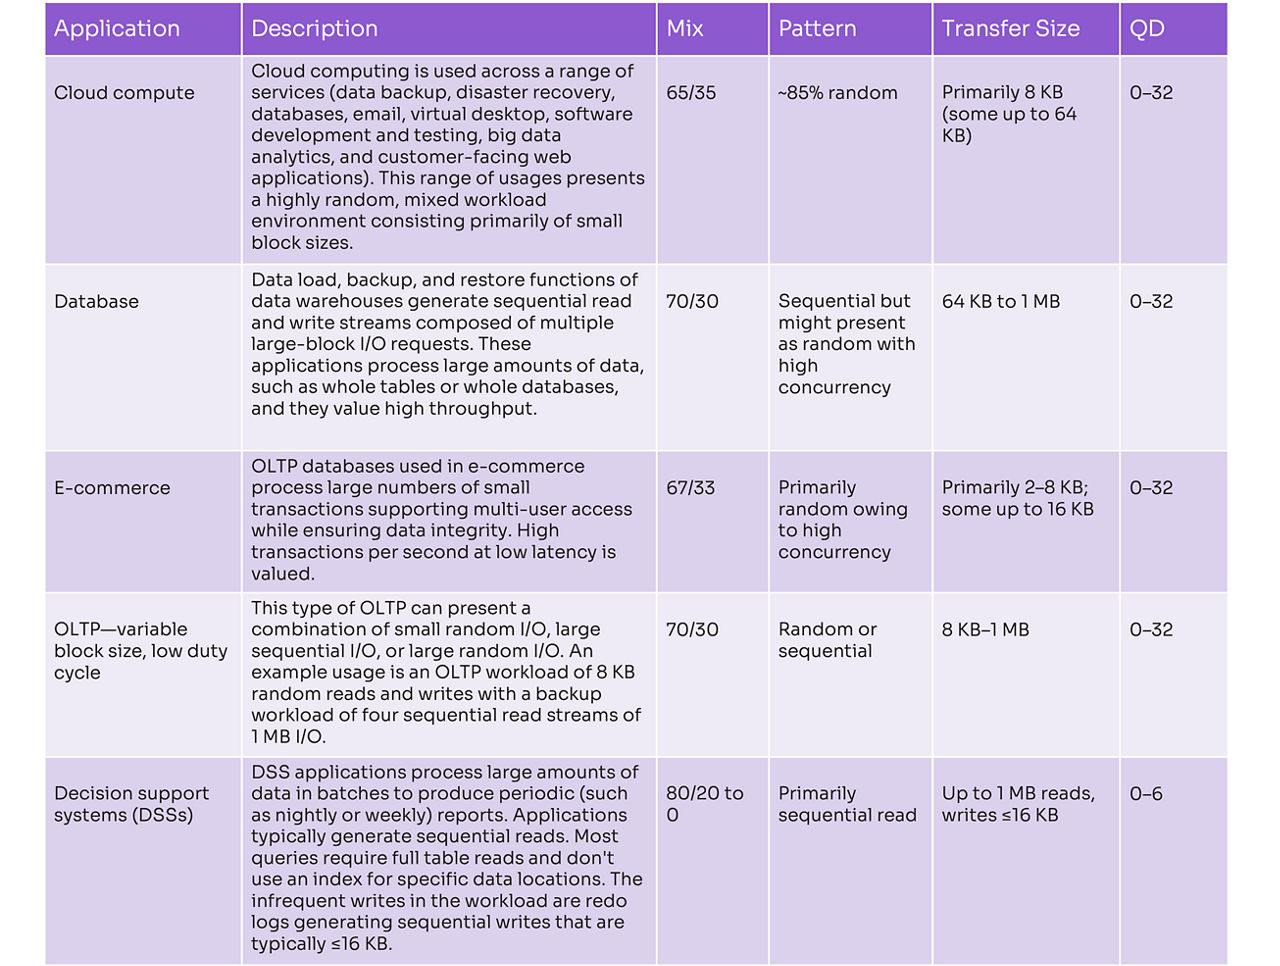
Table 4. Examples of applications with mixed workloads
3. Mainstream workloads
These workloads find broad adoption across enterprises and tend to cluster in the 75/25 to 80/20 read-to-write ratio range. While they may appear similar to mixed workloads, because the write mix is lower and often at a lower duty cycle, drives with strong read performance and a sufficient level of write performance can often be deployed in this category.
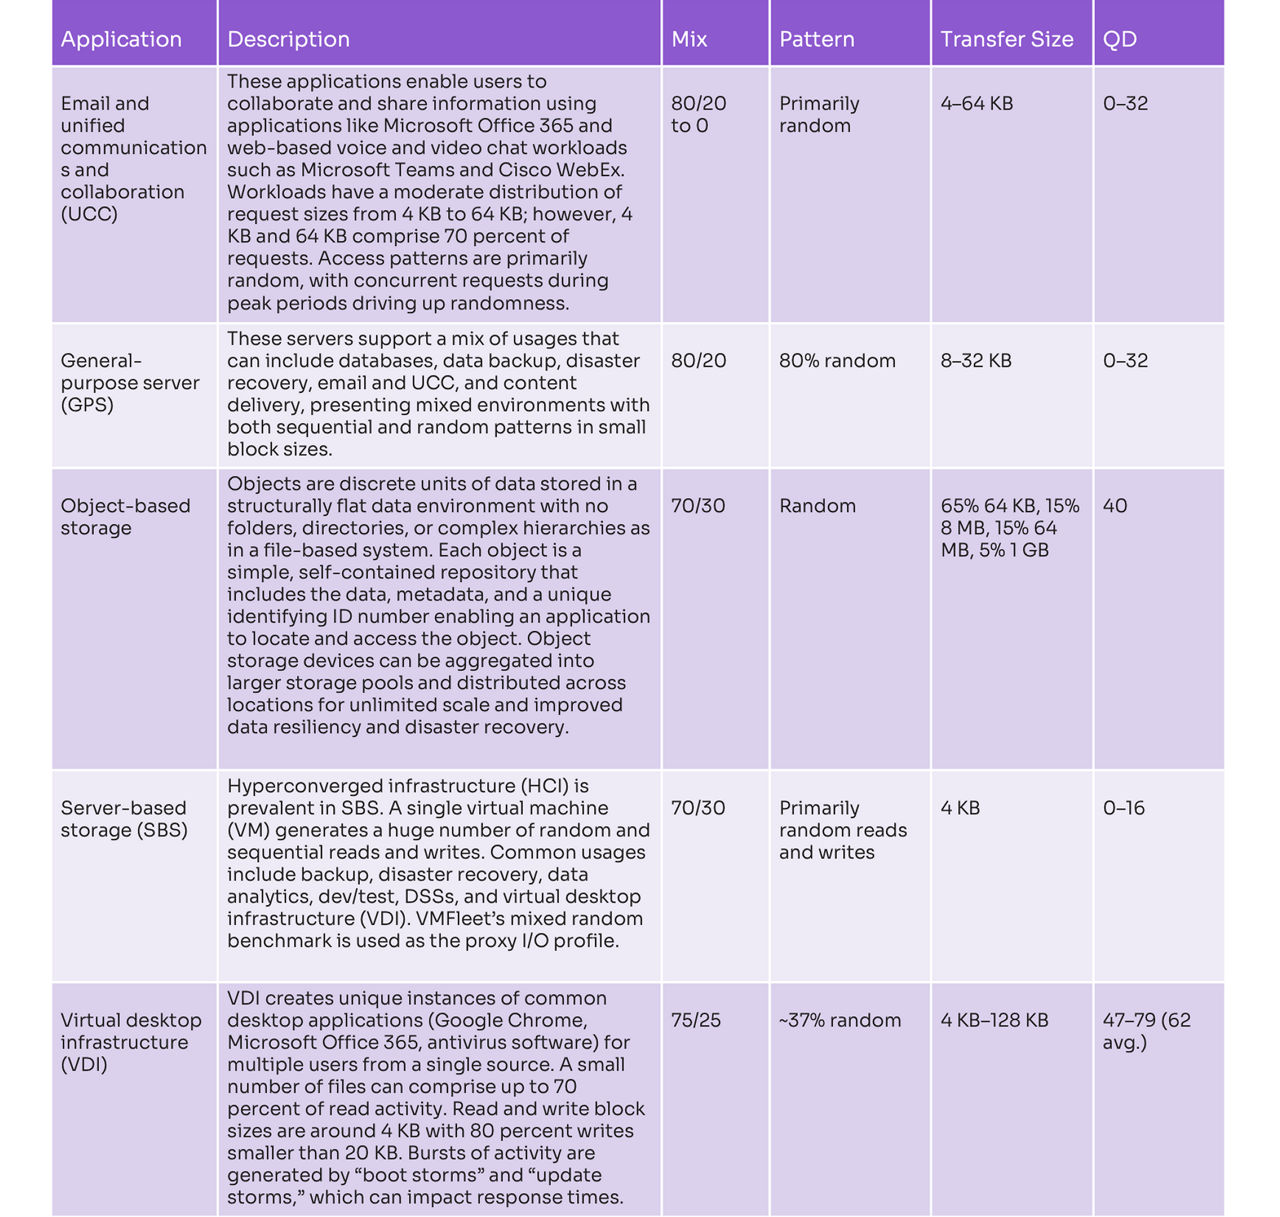
Table 5. Examples of mainstream application workloads
4. Read-intensive and data-intensive workloads
Applications in this category have a very high percentage of reads (90% or higher). Many of these applications are tasked with storing and moving massive amounts of data at high throughput. Some, however, are tasked simply with efficiently storing massive amounts of data that are accessed infrequently. Workloads in this category such as CDNs, data lakes, data pipelines, social media, retail websites, imaging databases, and VoD services are among the fastest-growing workloads in the industry. Table 6 profiles a select few of the applications in this category.
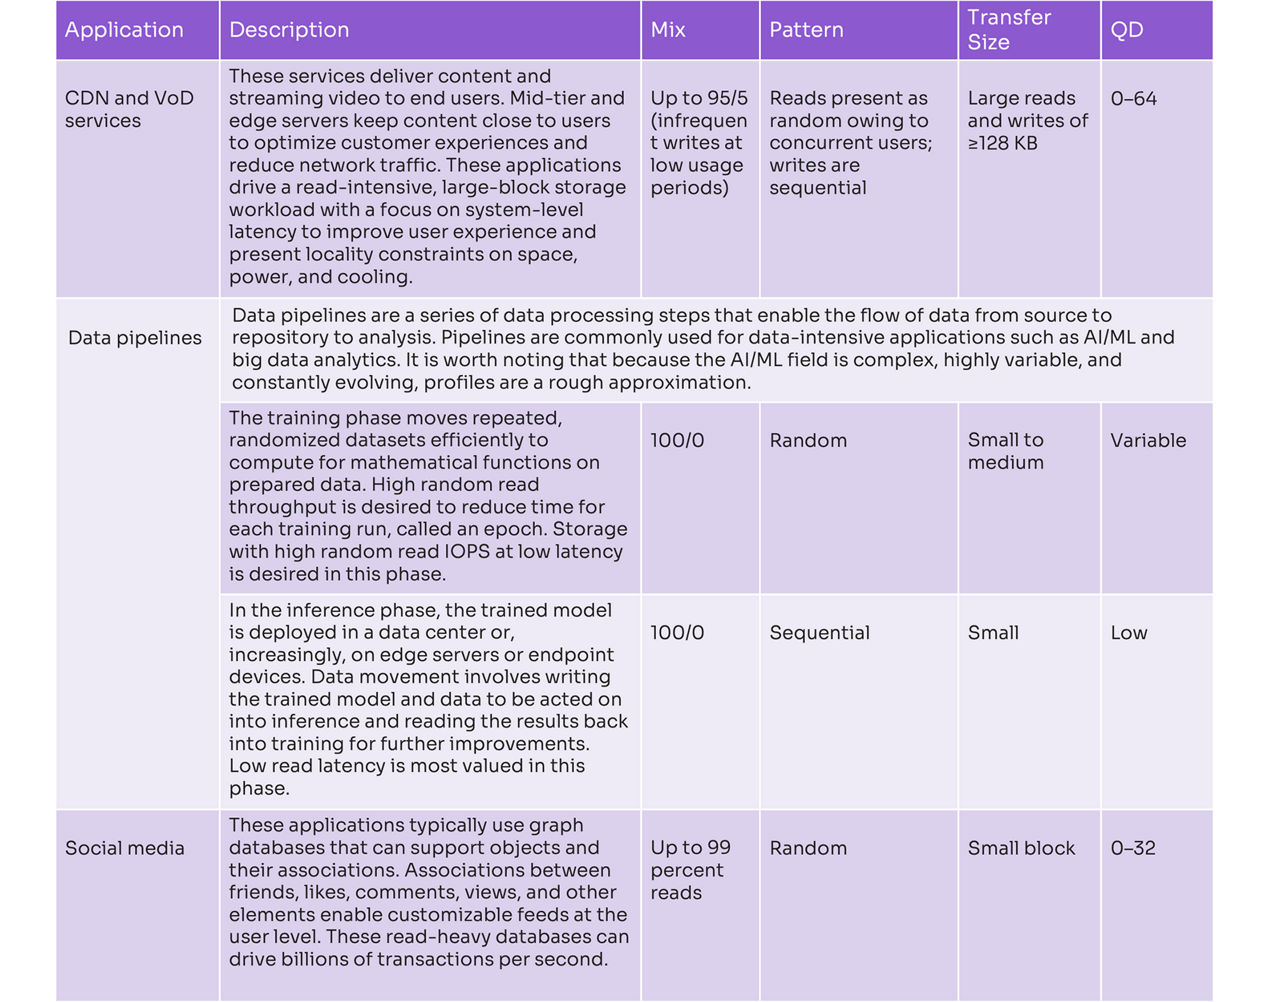
Table 6. Examples of applications with read/data-intensive workloads
Other considerations
Application engineers and storage architects must consider the I/O characteristics described in the preceding section, along with performance requirements such as IOPS, bandwidth, and latency, to select the right storage device. In addition, they should factor in solution-level requirements.
Solution-level requirements
As compute and storage become more distributed, solution-level requirements will need to include the additional constraints placed on deployments outside the core data center. While considerations such as space, power, cooling, and serviceability are important in data centers, these considerations have even more limitations placed on them at the edge. As space becomes scarcer and more expensive toward the edge, constraints between core data centers, regional/mid-tier data centers, micro-module data centers (cargo container-like structures), and street-side or cabinet-like deployments (1/4 to two full racks) will change. Regardless of locality, what these deployments have in common is that storage density and drive reliability will be critical factors.
Savvy service providers looking to deploy common hardware that will run in the largest number of locations will use the most stringent edge requirements to identify storage. Currently, however, industry standards for the edge are best described as “messy.” However, like the Open Compute Project, the Open 19 Foundation is a consortium setting open-source standards—for edge infrastructure, in this case. The Open19 Foundation’s server brick definition of half width x 1U with 400 W of power and 100G connectivity is a good example of edge requirements. [9]7 shows Solidigm’s view of how these and other factors at the edge could shape storage decision making at the solution level.
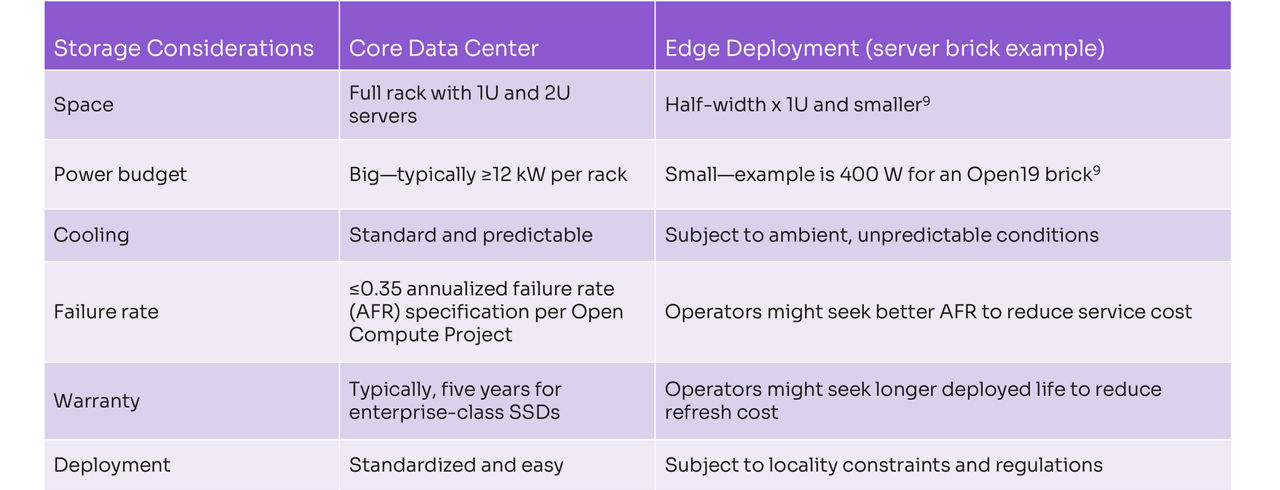
Table 7. Solution-level storage considerations
The density, efficiency, and serviceability advantages of quad-level cell (QLC) SSDs in general and QLC EDSFF SSDs specifically make them a strong choice for edge deployments and a viable storage solution for enterprises looking to deploy common hardware across the largest number of core-to-edge locations.
4 key criteria for SSD selection
Choosing the right drive from the right vendor can be a daunting task. Many storage decision makers still rely heavily on the previously mentioned “four corners” comparisons and an assumption that workloads cannot be supported with an endurance rating of less than 1 DWPD. Additionally, an erroneous assumption is often made that the quality and reliability of enterprise drives are consistent, across the board. Instead, storage decision makers should consider dense, fast, efficient, and highly reliable storage tuned to specific workload requirements when selecting SSDs. By focusing on the following four key selection factors, those decision makers can hone in on the right product.
1. Map drive capabilities to application requirements
Modern workloads require efficiently storing massive amounts of data and accessing that data at speed. An assumption persists that balancing these needs requires a tradeoff between performance and capacity; that is, select SSDs when an application requires performance, and choose HDDs when capacity is a higher value.
Recent advances in NAND technology, combined with a better understanding of workload requirements, have rendered that tradeoff assumption a moot point. Table 8 compares conventional thinking to the realities of today’s advanced QLC SSDs from Solidigm, compared to triple-level cell (TLC) SSD counterparts.
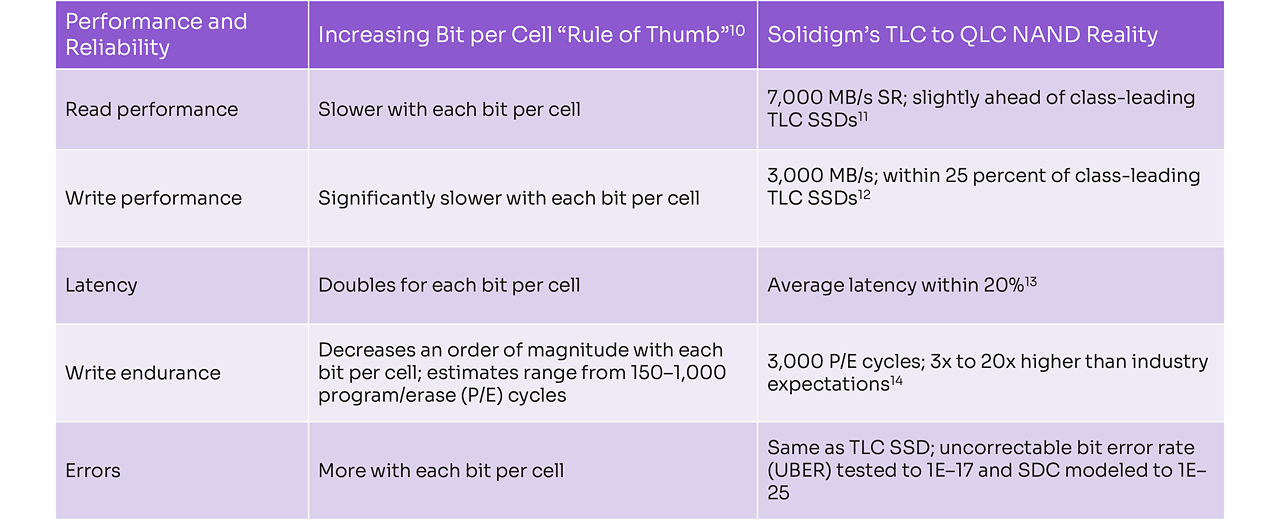
Table 8. Comparison of conventional viewpoints on QLC versus TLC SSD performance and reliability
NAND technology has evolved to where we are today, with a continuum of SSD products offering a wide range of performance, capacity, and endurance blends to right-size drives to workload requirements. Solidigm has utilized these advancements to develop a portfolio of products optimized for each workload category described earlier in this paper. To provide even more clarity, profiling tools—such as the Intel Storage Analytics I/O Tracer, Flexible I/O (fio), VMmark to benchmark virtualization platforms, and Yahoo! Cloud Serving Benchmark (YCSB) to profile NoSQL databases—are useful to precisely determine a profile.
In addition to matching a drive to workload I/O characteristics, the vectors of performance—latency, IOPS, and throughput—must be considered. It’s the job of storage architects to find the right balance to meet business objectives. Simply put, latency is about accelerating applications, such as delivering a better user experience in a VDI deployment or faster e-commerce transactions. IOPS is about scale, such as increasing concurrent users on OLTP or processing more parallel batches in databases. Throughput moves more data faster, speeding data loads for AI training or accelerating content loads of bigger CDN datasets for a better user experience.
2. Validate endurance requirements
Many mainstream and all read/data-intensive workloads do not generate a high level of write activity. The growth in these workloads is partially responsible for the reduction in endurance requirements to where we are today, with more than 85% of SSDs shipped to the data center at ≤1 DWPD. [6] As with every bit-per-cell transition, the introduction of QLC SSDs to the data center in 2018 raised endurance concerns. Now in its fourth generation, Solidigm™ QLC SSD endurance has continuously improved to 3K P/E cycles. Workload trends, along with QLC endurance improvements, create an opportunity to right-size endurance by looking at it in a new way.
A more informed way of assessing endurance is from the vantage point of PBW. This metric combines a drive’s endurance rating (DWPD) and its capacity to establish the writes available over the drive warranty period. Table 9 shows how the combination of improved endurance and massive QLC capacities can yield PBW values that are even greater than some TLC drives. High PBW means that QLC drives have ample endurance not just for read/data-intensive workloads but also for a broad range of mainstream workloads.

Table 9. Endurance characteristics of NAND SSDs
For storage decision makers who want a more precise assessment of their endurance needs, Solidigm offers both an endurance estimator and an endurance profiler tool. The endurance estimator is an intuitive tool that lets users enter workload characteristics to output a high-confidence estimation of drive life. The endurance profiler, available on GitHub, is a downloadable tool that users can install in their environments for generating precise endurance measurements.
3. Consider a modern form factor
The evolution of SSD form factors has presented limitations for the data center. Most notable was the lack of serviceability for the M.2 form factor, which got its start in laptop computers, and the space inefficiency of U.2, which was a way for SSDs to utilize existing HDD chassis. These challenges and others can now be addressed with EDSFF drives, which first began appearing in 2017. Given their serviceability, space efficiency, flexibility, cooling, and signal-integrity advantages, almost 40% of petabytes (PB) shipped into the data center are projected to be on EDSFF drives by 2025. [15] Solidigm believes that the transition to EDSFF will unfold along three paths:
- EDSFF E3.S will displace U.2 drives in 2U density-optimized servers for higher power/performance and increased flexibility to mix devices.
- EDSFF E1.S will be favored over U.2 and M.2 in 1U performance-optimized servers for its advantages in packing more IOPS in the same space and the thermal efficiency to either run faster processors or decrease cooling costs.
- EDSFF E1.L will be adopted in lieu of U.2 in 1U density-optimized servers for its value in storage density, cooling, and serviceability.
Figure 1 depicts how legacy form factors will transition to EDSFF by usage.
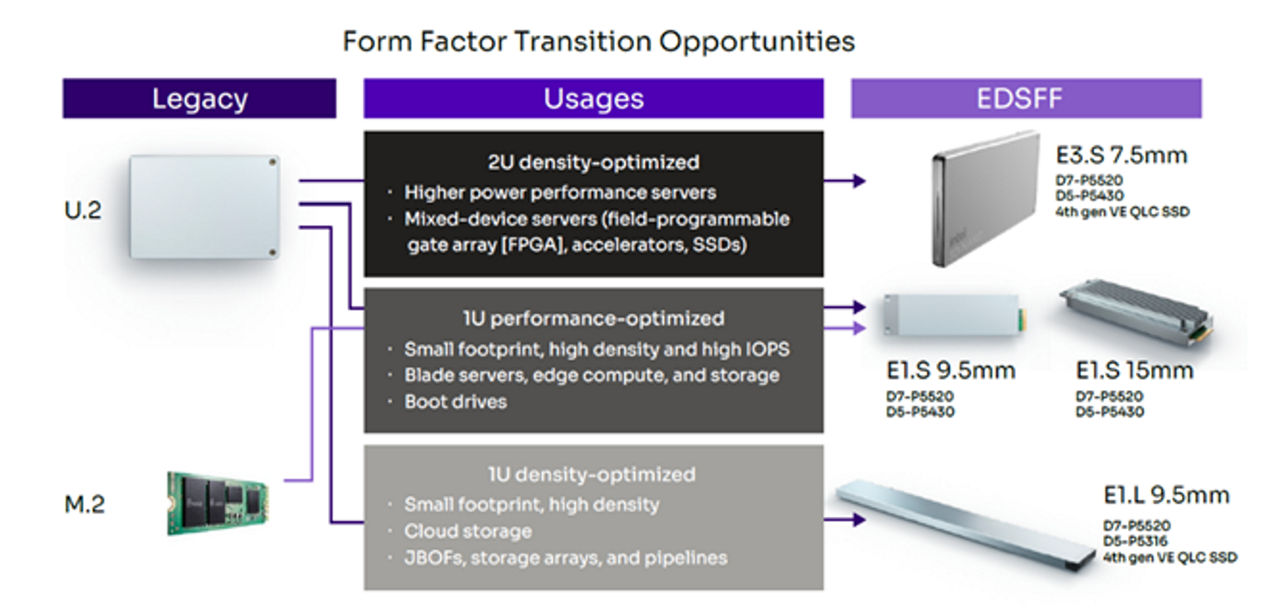
Figure 1. EDSFF form factors in Solidigm’s portfolio
For storage architects looking to preserve existing infrastructure, a U.2 portfolio spanning all Solidigm PCIe 4.0 products is available. However, as noted, the investment to transition to EDSFF can pay off on multiple vectors.
4. Be absolutely confident in drive and data reliability
As stated earlier, the most basic requirements of any storage solution are to always be available and to never return bad data. While all enterprise-class SSDs adhere to a set of drive-reliability and data-reliability standards (such as JESD218 and OCP 2.0), not all drives use the same design and test approaches to implement these specifications. Table 10 summarizes how Solidigm™ drives go beyond certain requirements for key specifications.
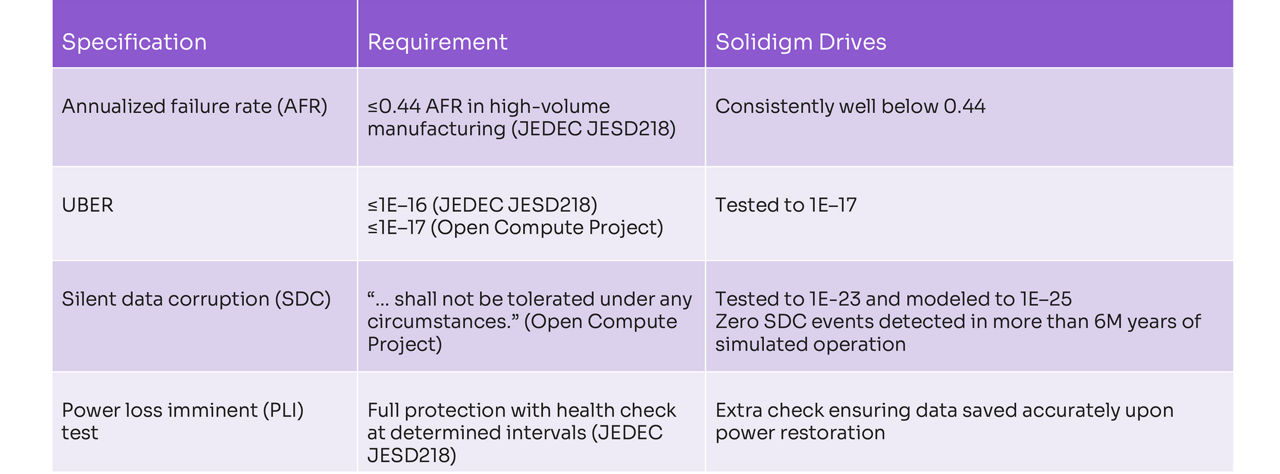
Table 10. Drive and data-reliability specifications and requirements
A good proxy for a drive’s overall data reliability is its resistance to silent data corruption (SDC). This is because reducing SDC risk considers end-to-end data path protection—error correction code (ECC) and cyclic redundancy check (CRC) redundancy, and full protection of all critical storage arrays in the controller—firmware methodologies, and drive “bricking” (disabling the drive if there is uncertainty of an event) methodologies. As indicated in Table 10 above, applying these techniques has resulted in zero SDC events detected on Solidigm drives in over 6 million years of simulated operation life spanning five generations of drive testing at Los Alamos National Labs. Furthermore, as shown in the chart on annualized failure rate (AFR) below, the same testing on other suppliers’ drives shows evidence of SDC events.
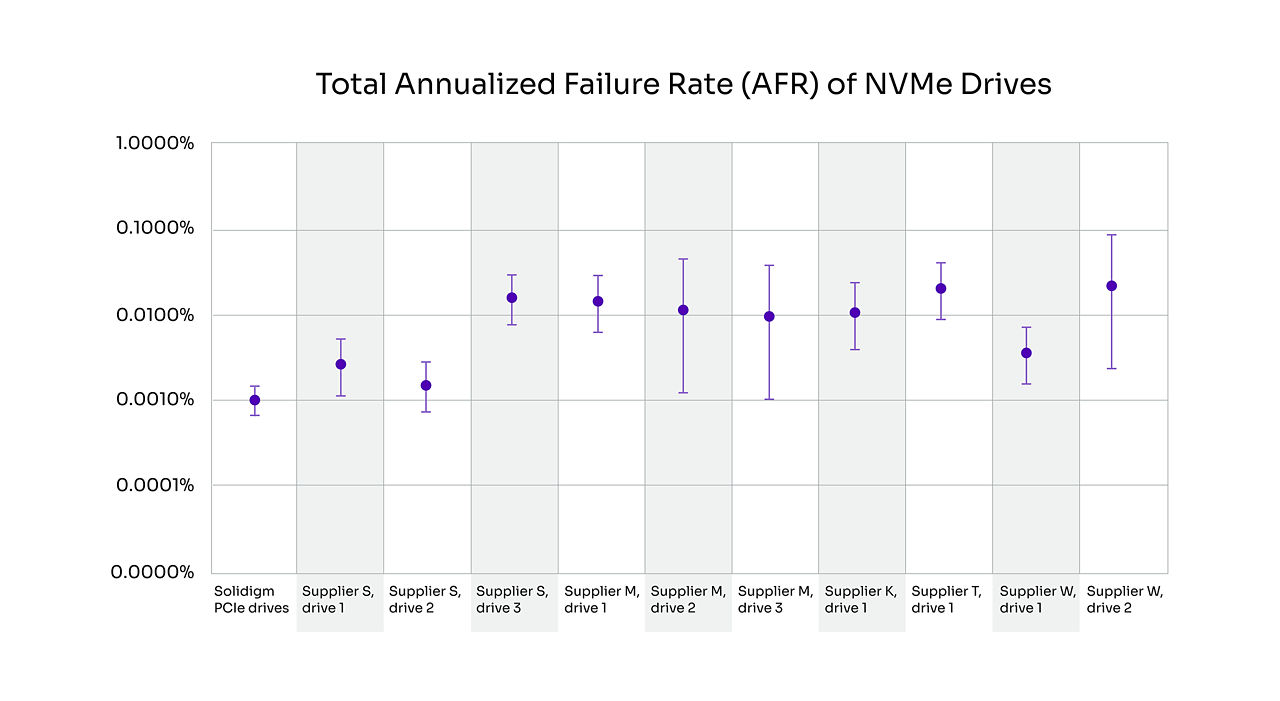
Figure 2. Total AFR (%) of NVMe drives [16]
Total AFR consists of Hang + DUE (Detectable Uncorrectable Errors) + Reboot SDC (data mis-compare observed after reboot of a drive) + Brick (containment of a drive in case of SDC suspected) + SDC. Given its comprehensive nature, we believe that total AFR is a strong measure of a drive’s overall data reliability. As shown in Figure 2 above, Solidigm PCIe 4.0 drives deliver superior data reliability across a wide spectrum of data center drives. The extra measures taken by Solidigm definitely matter, as disruptions to service and impacts to data integrity can have both near-term monetary consequences and longer-term impacts to an organization’s reputation that can be hard to overcome.
Choose the right drive that meets your specific needs
Choosing the right storage device is a crucial process. Solidigm’s portfolio, built on both TLC and QLC NAND SSDs, mitigates tradeoffs with QLC products that deliver massive, affordable capacities on highly efficient form factors with performance tuned for mainstream and read/data-intensive workloads.
Solidigm’s technology and product portfolio
Solidigm’s PCIe 4.0 portfolio spans the widest range of capacities, form factors, and endurance levels in the industry. [17] This range enables storage decision makers to find an optimal drive to meet their performance and solution requirements across a broad array of 1U and 2U chassis for both compute servers and storage servers spanning core data centers to edge servers.
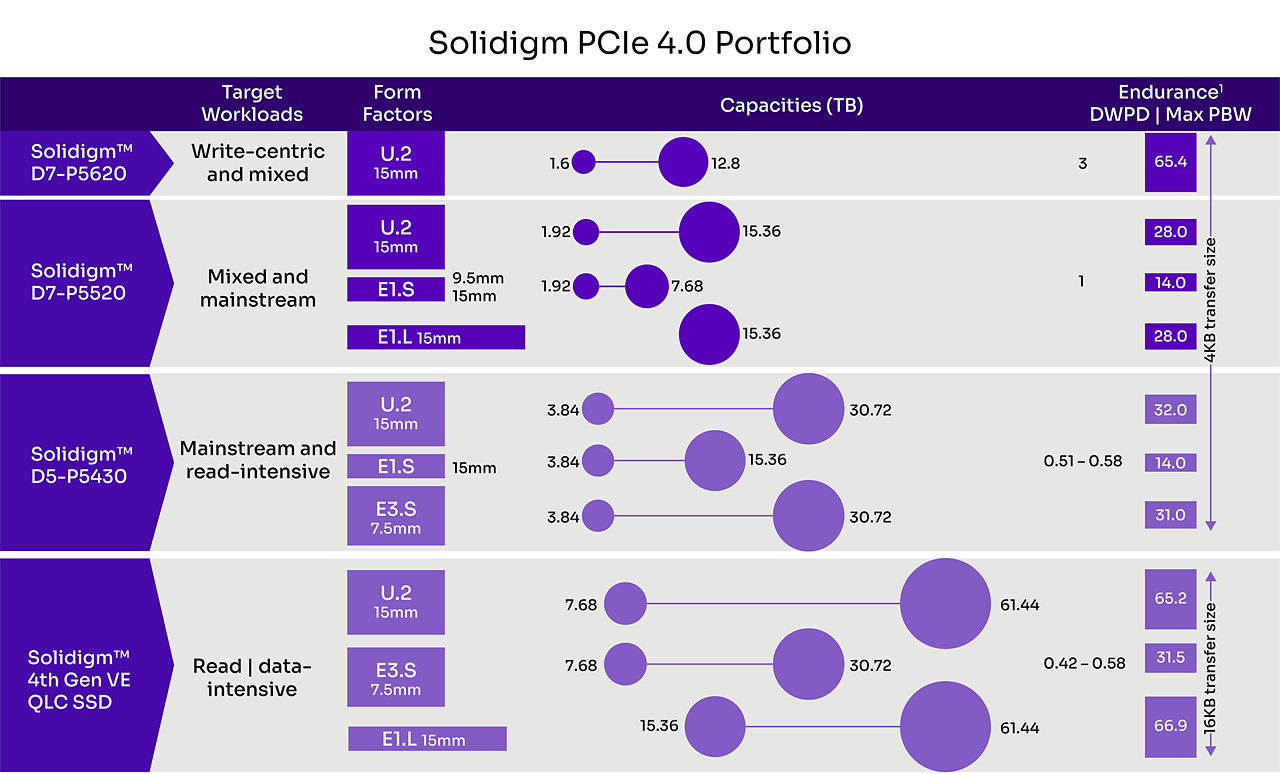
Figure 3. Solidigm PCIe 4.0 portfolio
Combining the portfolio above with an understanding of workload profiles described earlier in this paper, storage decision makers can begin to home in on optimizing their SSD selection. Figure 4 provides initial guidance on the right-sized SSD across a range of widely adopted workloads.
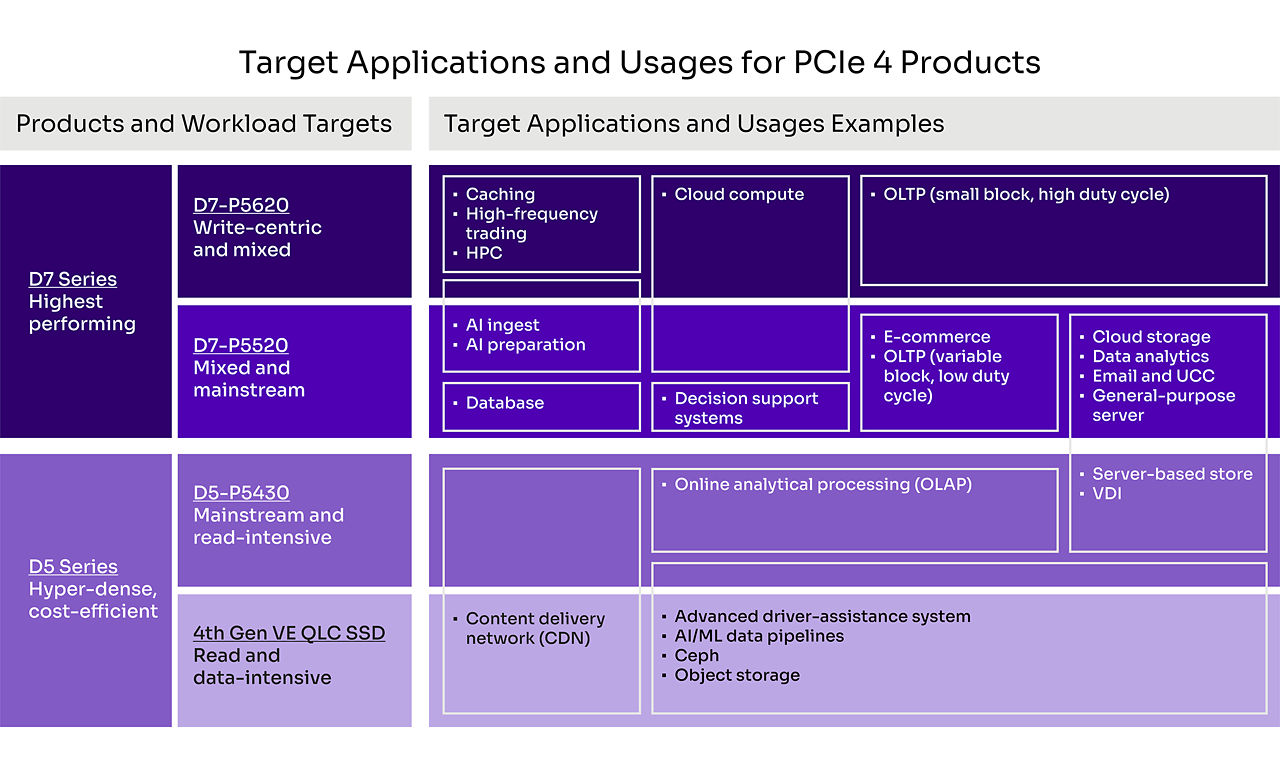
Figure 4. Taxonomy of Solidigm SSDs and workloads
While the taxonomy is a good first step, storage decision makers will need to consider the full range of criteria outlined in this paper to finalize their SSD selections.
Visit solidigm.com to learn more about these products. Try out our tools to help with your SSD selection process.
[1] Solidigm analysis based on data from World Bank and Gartner Q2 2022.
[2] USENIX. “Operational Characteristics of SSDs in Enterprise Storage Systems: A Large-Scale Field Study.” February 2022. www.usenix.org/system/files/fast22-maneas.pdf.
[3] AI News. “State of AI 2022: Adoption plateaus but leaders increase gap.” December 2022. www.artificialintelligence-news.com/2022/12/07/state-of-ai-2022-adoption-plateaus-leaders-increase-gap/.
[4] IDC. “New IDC Spending Guide Forecasts Edge Computing Investments Will Reach $208 Billion in 2023.” www.idc.com/getdoc.jsp?containerId=prUS50386323.
[5] The Linux Foundation. “State of the Edge Report 2020 - State of the Edge.” https://stateoftheedge.com/reports/state-of-the-edge-2020/.
[6] TechTarget. “QLC vs. TLC SSDs – Which is best for your storage?” June 2022. www.techtarget.com/searchstorage/tip/QLC-vs-TLC-NAND-Which-is-best-for-your-storage-needs.
[7] University of Toronto study of 1.4 million industry SSDs in enterprise storage deployment. Source: USENIX. “A Study of SSD Reliability in Large Scale Enterprise Storage Deployments.” www.usenix.org/conference/fast20/presentation/maneas.
[8] Enterprise Storage Forum. “Survey Spotlights Top 5 Data Storage Pain Points.” August 2018. www.enterprisestorageforum.com/management/survey-spotlights-top-5-data-storage-pain-points/.
[9] Open19. “An Open Standard for the Datacenter.” www.open19.org/technology/.
[10] TechTarget. “Performance, reliability tradeoffs with SLC vs. MLC and more.” September 2021. www.techtarget.com/searchstorage/tip/The-truth-about-SLC-vs-MLC.
[11] Comparing sequential read bandwidth of 6,700 MB/s for Samsung PM9A3 and 7,000 MB/s for Solidigm D5-P5430.
[12] Comparing sequential write bandwidth of 4,000 MB/s for Samsung PM9A3 and 3,000 MB/s for Solidigm D5-P5430.
[13] Comparing latency of 15.36 TB Solidigm D5-P5520 of 4 KB RR (75 µs), 4 KB RW (20 µs), 4 KB SR (10 µs), and 4 KB SW (13 µs) for an average of 29 µs to latency of 15.36 TB Solidigm D5-P5430 of 4 KB RR (109 µs), 4 KB RW (14 µs), 4 KB SR (8 µs), and 4 KB SW (10 µs) for an average of 35 µs.
[14] Industry expectations as defined in https://www.techtarget.com/searchstorage/tip/The-truth-about-SLC-vs-MLC.
[15] Forward Insights. SSD Insights Q1 2022.
[16] Solidigm drives are tested at the neutron source at Los Alamos National Labs to measure Silent Data Corruption susceptibility to 1E–23 and modeled to 1E–25. The testing procedure begins with prefilling the drives with a certain data pattern. Next, the neutron beam is focused on the center of the drive controller while I/O commands are continuously issued and checked for accuracy. If the drive fails and hangs/bricks, the test script powers down the drives and the neutron beam is turned off. The drive is subsequently rebooted, and data integrity is checked to analyze the cause of failure. SDC can be observed during a runtime causing a power down command or after reboot if the neutron beam has hit the control logic, hanging the drive as a result of in-flight data becoming corrupted. Because drives go into a disable logical—brick—state when they cannot guarantee data integrity, brick AFR is used as the measure of error handling effectiveness. Intel/Solidigm drives have used this testing procedure across four generations.
[17] Comparing the KIOXIA CD6-R SSD, available in U.2 960 GB to 15.36 TB, the Micron 7450 Pro SSD, available in U.2 960 GB to 15.36 TB and E1.S 960 GB to 7.68 TB, the Samsung PM9A3 SSD, available in U.2 960 GB to 7.68 TB, and the Solidigm D5-P5430, available or soon to be available in U.2 7.68 TB to 30.72 TB, E1.S 3.84 TB to 15.36 TB, and E3.S in 3.84 TB to 30.72 TB. Solidigm D5-P5430 has higher max capacities for U.2 and E1.S, and it is the only drive in its class supporting the E3.S form factor.
All information provided is subject to change at any time, without notice. Solidigm may make changes to manufacturing life cycle, specifications, and product descriptions at any time, without notice. The information herein is provided "as-is" and Solidigm does not make any representations or warranties whatsoever regarding accuracy of the information, nor on the product features, availability, functionality, or compatibility of the products listed. Please contact system vendor for more information on specific products or systems.
Refer to the spec sheet for formal definitions of product properties and features. Solidigm may make changes to specifications and product descriptions at any time, without notice. Designers must not rely on the absence or characteristics of any features or instructions marked "reserved" or "undefined." Solidigm reserves these for future definition and shall have no responsibility whatsoever for conflicts or incompatibilities arising from future changes to them. The information here is subject to change without notice. Do not finalize a design with this information.
Solidigm technologies may require enabled hardware, software or service activation. No product or component can be absolutely secure. Your costs and results may vary. Performance varies by use, configuration and other factors. Solidigm is committed to respecting human rights and avoiding complicity in human rights abuses. Solidigm products and software are intended only to be used in applications that do not cause or contribute to a violation of an internationally recognized human right. Solidigm does not control or audit third-party data. You should consult other sources to evaluate accuracy.
Nothing herein is intended to create any express or implied warranty, including without limitation, the implied warranties of merchantability, fitness for a particular purpose, and non-infringement, or any warranty arising from course of performance, course of dealing, or usage in trade.
The products described in this document may contain design defects or errors known as “errata,” which may cause the product to deviate from published specifications. Current characterized errata are available on request.
“Solidigm” is a trademark of SK hynix NAND Product Solutions Corp (d/b/a Solidigm). “Intel” is a registered trademark of Intel Corporation. Other names and brands may be claimed as the property of others.
© Solidigm 2023. All rights reserved.